Spectrogram
From Wikipedia, the free encyclopedia
|
|
This article may contain original research or unverified claims. Please improve the article by adding references. See the talk page for details. (May 2008) |

A spectrogram is an image that shows how the spectral density of a signal varies with time. Also known as spectral waterfalls, sonograms, voiceprints, or voicegrams, spectrograms are used to identify phonetic sounds, to analyse the cries of animals, and in the fields of music, sonar/radar, speech processing, seismology, etc. The instrument that generates a spectrogram is called a spectrograph or sonograph.
Contents |
[edit] Format
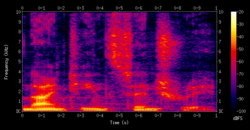
The most common format is a graph with two geometric dimensions: the horizontal axis represents time, the vertical axis is frequency; a third dimension indicating the amplitude of a particular frequency at a particular time is represented by the intensity or colour of each point in the image.
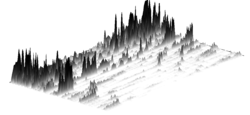
There are many variations of format: sometimes the vertical and horizontal axes are switched, so time runs up and down; sometimes the amplitude is represented as the height of a 3D surface instead of color or intensity. The frequency and amplitude axes can be either linear or logarithmic, depending on what the graph is being used for. For instance, audio would usually be represented with a logarithmic amplitude axis (probably in dB), and frequency would be linear to emphasize harmonic relationships, or logarithmic to emphasize musical, tonal relationships.
[edit] Generation


Spectrograms are usually created in one of two ways: with a series of bandpass filters (this was the only way before the advent of modern digital signal processing), or calculated from the time signal using the short-time Fourier transform (STFT).
The bandpass filters method usually uses analog processing to divide the input signal into frequency bands; the magnitude of each filter's output controls a transducer that records the spectrogram as an image on paper.[1]
Creating a spectrogram using the STFT is usually a digital process. Digitally sampled data, in the time domain, is broken up into chunks, which usually overlap, and Fourier transformed to calculate the magnitude of the frequency spectrum for each chunk. Each chunk then corresponds to a vertical line in the image; a measurement of magnitude versus frequency for a specific moment in time. The spectrums or time plots are then "laid side by side" to form the image or a three-dimensional surface.[2]
The spectrogram is given by the squared magnitude of the STFT of the function:

[edit] Applications

- Early analog spectrograms were applied to the study of bird calls, with current research continuing using modern digital equipment[4] and applied to all animal sounds. It is especially useful for studying frequency modulation in animal calls.
- Spectrograms are useful in assisting the overcoming of speech defects and in speech training for that portion of the population that is profoundly deaf[5]
- The studies of phonetics and speech synthesis are often facilitated through the use of spectrograms[6][7].
- By reversing the process of producing a spectrogram, it is possible to create a signal whose spectrogram is an arbitrary image. This technique can be used to hide a picture in a piece of audio and has been employed by several electronic music artists[8]. See also steganography.
- Some modern music is created using spectrograms as an intermediate medium; changing the intensity of different frequencies over time, or even creating new ones, by drawing them and then inverse transforming. See Audio timescale-pitch modification and Phase vocoder.
- Spectrograms can be used to analyse the results of passing a test signal through a signal processor such as a filter in order to check its performance[9].
[edit] Limitations
From the formula above, it can be seen that a spectrogram contains no information about the phase of the signal that it represents. For this reason, it is not possible to reverse the process and generate a copy of the original signal from a spectrogram, though in situations where phase is unimportant (of which audio is often one), it may be possible to generate a useful approximation of the original signal. The Analysis & Resynthesis Sound Spectrograph is an example of a computer program that attempts to do this.
[edit] See also
- Short-time Fourier transform
- Spectrometer
- Spectrum
- Wavelet transform
- Time-frequency representation
- Strobe tuners
[edit] References
- ^ Illustration of an electro-mechanical spectrograph
- ^ Spectrogram definition
- ^ STFT spectrogram details
- ^ Bird Songs and Spectrograms of Southern Tuscany
- ^ A wearable tactile sensory aid for profoundly deaf children
- ^ Spectrogram Reading
- ^ Praat - doing phonetics by computer
- ^ Several sound spectrogram examples, including the one by Aphex Twin
- ^ Example of using spectrograms to check filter responses
[edit] External links
| Wikimedia Commons has media related to: Spectrogram |
| Look up spectrogram in Wiktionary, the free dictionary. |
- Sonogram Visible Sound is a Sonogram generation Software written in Java. It can directely be started via Java WebStart from the WebPage
- DiscreteTFDs - software for computing spectrograms and other time-frequency distributions
- WaveSurfer - KTH Speech, Music and Hearing
- baudline signal analyzer - FFT spectrogram
- Spectrograms of vocalisations of over 5100 bird species

