Stock valuation
From Wikipedia, the free encyclopedia
|
|
This article or section has multiple issues. Please help improve the article or discuss these issues on the talk page.
|
There are several methods used to value companies and their stocks. They attempt to give an estimate of their fair value, by using fundamental economic criteria. This theoretical valuation has to be perfected with market criteria, as the final purpose is to determine potential market prices.
Contents |
[edit] Fundamental criteria (fair value)
most theoretically sound stock valuation method, called income valuation or the discounted cash flow (DCF) method, involves discounting of the profits (dividends, earnings, or cash flows) the stock will bring to the stockholder in the foreseeable future, and a final value on disposition.[1] The discounted rate normally includes a risk premium which is commonly based on the capital asset pricing model.
[edit] Approximate valuation approaches
Average growth approximation: Assuming that two stocks have the same earnings growth, the one with a lower P/E is a better value. The P/E method is perhaps the most commonly used valuation method in the stock brokerage industry.[citation needed] By using comparison firms, a target price/earnings (or P/E) ratio is selected for the company, and then the future earnings of the company are estimated. The valuation's fair price is simply estimated earnings times target P/E. This model is essentially the same model as Gordon's model, if k-g is estimated as the dividend payout ratio (D/E) divided by the target P/E ratio.
Constant growth approximation: The Gordon model or Gordon's growth model[2] is the best known of a class of discounted dividend models. It assumes that dividends will increase at a constant growth rate (less than the discount rate) forever. The valuation is given by the formula:
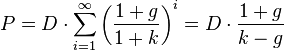 .
.
and the following table defines each symbol:
| Symbol | Meaning | Units |
|---|---|---|
 |
estimated stock price | $ or € or £ |
 |
last dividend paid | $ or € or £ |
 |
discount rate | % |
 |
the growth rate of the dividends | % |
Limited high-growth period approximation: When a stock has a significantly higher growth rate than its peers, it is sometimes assumed that the earnings growth rate will be sustained for a short time (say, 5 years), and then the growth rate will revert to the mean. This is probably the most rigorous approximation that is practical [3].
While these DCF models are commonly used, the uncertainty in these values is hardly ever discussed. Note that the models diverge for  and hence are extremely sensitive to the difference of dividend growth to discount factor. One might argue that an analyst can justify any value (and that would usually be one close to the current price supporting his call) by fine-tuning the growth/discount assumptions.
[edit] Market criteria (potential price)
Some feel that if the stock is listed in a well organized stock market, with a large volume of transactions, the listed price will be close to the estimated fair value.[citation needed] This is called the efficient market hypothesis.
On the other hand, studies made in the field of behavioral finance tend to show that deviations from the fair price are rather common, and sometimes quite large.[citation needed]
Thus, in addition to fundamental economic criteria, market criteria also have to be taken into account market-based valuation. Valuing a stock is not only to estimate its fair value, but also to determine its potential price range, taking into account market behavior aspects. One of the behavioral valuation tools is the stock image, a coefficient that bridges the theoretical fair value and the market price.
[edit] On-line valuation calculators
- iStockResearch: Free intrinsic value (or fair value) calculation tool based on original stock valuation model.
- InValueAble.net: Free stock valuation site using full financial statement approach to calculate intrinsic value. Sign-in required.
- Online Preferred and Common Stock Valuation Calculator
- http://www.moneychimp.com/articles/valuation/dcf.htm: Discounted Cash Flows Calculator that assumes that a higher growth can be sustained for a limited number of years.
- http://intelligentinvesting.googlepages.com/DCF.xls: A DCF spreadsheet that allows different growth rates to be specified for years 1, 2 to 4, 5 to 7 and 8 to 10.
- Baseline evaluation: Automatically fetches baseline data for popular stocks. Allows valuation with different assumptions like variable excess return period.
- Public Company Valuations: Free discounted cash flow (DCF) valuation tool for major listed companies.
[edit] See also
- Stock selection criteria
- Bond valuation
- Real estate valuation
- Active portfolio management
- List of valuation topics
- Capital asset pricing model
- Value at risk
- Mosaic theory
- Fundamental analysis
- Technical analysis
- Fed model Theory of Equity Valuation
- Undervalued stock
- John Burr Williams: Theory
[edit] References
- ^ William F. Sharpe, "Investments", Prentice-Hall, 1978, pp. 300 et.seq.
- ^ Corporate Finance, Stephen Ross, Randolph Westerfield, and Jeffery Jaffe, Irwin, 1990, pp. 115-130.
- ^ Discounted Cash Flow Calculator for Stock Valuation
[edit] External links
|
|||||||||||||||||||||||

