Design of experiments
From Wikipedia, the free encyclopedia
|
|
It has been suggested that Study design be merged into this article or section. (Discuss) |
Design of experiments, or experimental design, is the design of all information-gathering exercises where variation is present, whether under the full control of the experimenter or not. (The latter situation is usually called an observational study.) Often the experimenter is interested in the effect of some process or intervention (the "treatment") on some objects (the "experimental units"), which may be people. Design of experiments is thus a discipline that has very broad application across all the natural and social sciences.
Contents |
[edit] Early example of experimental design
In 1747, while serving as surgeon on HM Bark Salisbury, James Lind, the ship's surgeon, carried out a controlled experiment to develop a cure for scurvy.
Lind selected 12 men from the ship, all suffering from scurvy, and divided them into six pairs, giving each group different additions to their basic diet for a period of two weeks. The treatments were all remedies that had been proposed at one time or another. They were:
- A quart of cider every day
- Twenty five gutts (drops) of elixir vitriol (sulphuric acid) three times a day upon an empty stomach,
- One half-pint of seawater every day
- A mixture of garlic, mustard, and horseradish in a lump the size of a nutmeg
- Two spoonfuls of vinegar three times a day
- Two oranges and one lemon every day.
The men who had been given citrus fruits recovered dramatically within a week. One of them returned to duty after 6 days and the other became nurse to the rest. The others experienced some improvement, but nothing was comparable to the citrus fruits, which were proved to be substantially superior to the other treatments.
In this study his subjects' cases "were as similar as I could have them", that is he provided strict entry requirements to reduce extraneous variation. The men were paired, which provided replication. From a modern perspective, the main thing that is missing is randomized allocation of subjects to treatments.
[edit] A formal mathematical theory
The first statistician to consider a formal mathematical methodology for designing experiments was Sir Ronald A. Fisher, in his landmark The Design of Experiments. As an example, he described how to test the hypothesis that a certain lady could distinguish by flavour alone whether the milk or the tea was first placed in the cup. While this sounds like a frivolous application, it allowed him to illustrate the most important means of experimental design:
1.) Comparison
In many fields of study it is hard to reproduce measured results exactly. Comparisons between treatments are much more reproducible and are usually preferable. Often one compares against a standard or traditional treatment that acts as baseline.
2.) Randomization
There is an extensive body of mathematical theory that explores the consequences of making the allocation of units to treatments by means of some random mechanism such as tables of random numbers, or the use of randomization devices such as playing cards or dice. Provided the sample size is adequate, the risks associated with random allocation (such as failing to obtain a representative sample in a survey, or having a serious imbalance in a key characteristic between a treatment group and a control group) are calculable and hence can be managed down to an acceptable level. Random does not mean haphazard, and great care must be taken that appropriate random methods are used.
3.) Replication
Measurements are usually subject to variation, both between repeated measurements and between replicated items or processes. Multiple measurements of replicated items are necessary so the variation can be estimated.
4.) Blocking
Blocking is the arrangement of experimental units into groups (blocks) that are similar to one another. Blocking reduces known but irrelevant sources of variation between units and thus allows greater precision in the estimation of the source of variation under study.
5.) Orthogonality
Orthogonality concerns the forms of comparison (contrasts) that can be legitimately and efficiently carried out. Contrasts can be represented by vectors and sets of orthogonal contrasts are uncorrelated and independently distributed if the data are normal. Because of this independence, each orthogonal treatment provides different information to the others. If there are T treatments and T – 1 orthogonal contrasts, all the information that can be captured from the experiment is obtainable from the set of contrasts.
6.) Use of factorial experiments instead of the one-factor-at-a-time method. These are efficient at evaluating the effects and possible interactions of several factors (independent variables).
Analysis of the design of experiments was built on the foundation of the analysis of variance, a collection of models in which the observed variance is partitioned into components due to different factors which are estimated and/or tested.
Some efficient designs for estimating several main effects simultaneously were found by Raj Chandra Bose and K. Kishen in 1940 at the Indian Statistical Institute, but remained little known until the Plackett-Burman designs were published in Biometrika in 1946. About the same time, C. R. Rao introduced the concepts of orthogonal arrays as experimental designs. This was a concept which played a central role in the development of Taguchi methods by Genichi Taguchi, which took place during his visit to Indian Statistical Institute in early 1950s. His methods were successfully applied and adopted by Japanese and Indian industries and subsequently were also embraced by US industry albeit with some reservations.
In 1950, Gertrude Mary Cox and William Gemmell Cochran published the book Experimental Designs which became the major reference work on the design of experiments for statisticians for years afterwards.
Developments of the theory of linear models have encompassed and surpassed the cases that concerned early writers. Today, the theory rests on advanced topics in linear algebra, abstract algebra and combinatorics.
As with all other branches of statistics, there is both classical and Bayesian experimental design.
Some important notable contributors to the field of experimental designs are R. A. Fisher, R. C. Bose, C. R. Rao, J. Keifer, J. N. Srivastava, Shrikhande S. S., Genichi Taguchi, D. Raghavarao, D. Montgomery, and R. Myers.
[edit] Example
This example is attributed to Harold Hotelling.[1] It conveys some of the flavor of those aspects of the subject that involve combinatorial designs.
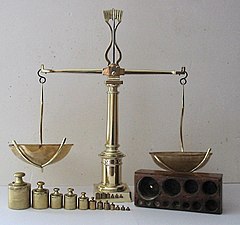
The weights of eight objects are to be measured using a pan balance and set of standard weights. Each weighing measures the weight difference between objects placed in the left pan vs. any objects placed in the right pan by adding calibrated weights to the lighter pan until the balance is in equilibrium. Each measurement has a random error. The average error is zero; the standard deviations of the probability distribution of the errors is the same number σ on different weighings; and errors on different weighings are independent. Denote the true weights by

We consider two different experiments:
- Weigh each object in one pan, with the other pan empty. Let Xi be the measured weight of the ith object, for i = 1, ..., 8.
- Do the eight weighings according to the following schedule and let Yi be the measured difference for i = 1, ..., 8:

- Then the estimated value of the weight θ1 is
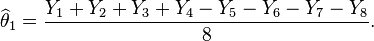
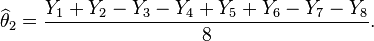
- Similar estimates can be found for the weights of the other items. For example
The question of design of experiments is: which experiment is better?
The variance of the estimate X1 of θ1 is σ2 if we use the first experiment. But if we use the second experiment, the variance of the estimate given above is σ2/8. Thus the second experiment gives us 8 times as much precision for the estimate of a single item, and estimates all items simultaneously, with the same precision. What is achieved with 8 weighings in the second experiment would require 64 weighings if items are weighed separately. However, note that the estimates for the items obtained in the second experiment have errors which are correlated with other.
Many problems of the design of experiments involve combinatorial designs, as in this example.
[edit] Step-by-step procedure in the effective design of an experiment
Experiment design[2]:
1. Select problem In order to design an experiment, a problem has to be selected and phrased. It is the selection and the phrasing of the problem that will direct the design and outcomes of an experiment. The simplest and most concise way of phrasing a problem is by addressing the “Who, What, When, Why and How” questions. To illustrate the purpose of stating a problem, assume an experiment is designed in which data on automobile accidents is collected. Depending on how the problem is states, the experiment could be serving to either design a new automobile, or design a new road surface. Thus, even though the same set of data is used, the purposed of the experiment is vastly different, depending on how the problem is stated. Many times, research or experiments have already been completed regarding this issue or similar to your question. In designing the experiment, you need to consider underlying models that have already been proven to make your research more in depth and accurate.
2. Determining dependent variables The dependent variables are the variables that are being measured throughout the experiment. There can be many different dependent variables measured during an experiment. First, you need to split the dependent variables into two different subcategories, system level and individual level. On a system level, questions are taken into consideration regarding the experiment itself taking place. System level variables need to be created to ensure that when the conclusion is reached, it is backed up by as many different angles as possible to support the conclusion. This idea is known as converging operations. For example, a system level dependent variable is how many experimenters are used during a certain task. On an individual level, the dependent variables are measurements of a particular subject. Individual level dependent variables need to be a reducible and analyzable measurement. If the experiment were repeated identically, the individual variables need to provide identical data while removing all risks possible. For example, the amount of time it takes for a certain participant to complete a task. Both system-level and individual level dependent variables need to be concrete enough that the audience reading the experiment will accept the found data.
Dependent variables can include performance measures, subjective measures, and physical response. Performance measures include examples such as how long it took for the participant to complete the task as well as the number of mistakes that were made. Subjective measures include whether or not the participants preferred the method used and how many scales were used during the experiment. Finally, physical responses include injuries that occurred or changes in physiological measurements.
3. Determining independent variables The independent variables are the variables that are manipulated in the experiment. Independent variables include things related to people such as age, sex, vision, level of education or general work experience. This brings about the topic of obtaining suitable human subjects. To ensure that the specifications of the independent variables are met, subjects should be screened prior to running the experiment. Subjects may be offered an incentive in cash or kind in exchange for their cooperation.
4. Determining the number of levels of independent variables The number of levels of independent variables determines the number of experimental conditions to be manipulated. This is important in determining the extent of the scope of the experiment. For example, if an experimenter were to design an experiment to examine the relative performance of 10 automobiles, the independent variable, in this case the type of automobile, would have 10 levels.
5. Determining the possible combinations The types of combinations between the independent variables have to be established in order for the experiment to be valid. Using the earlier example of automobiles, it may not be feasible to compare Model A with an automatic transmission with Model B which has a manual transmission. Therefore, it is important to establish the possible types of combinations.
6. Determining the number of observations It is insufficient to obtain one observation. Depending on the desired analysis, there are certain factors that need to be taken into consideration when deciding on the number of observations. This includes the number of trials before a subject becomes familiar with the experiment, the number of trials before fatigue sets in and the number of trials required to obtain statically significant data.
7. Redesign Redesign is necessary in order to obtain the optimal design. When flaws or inconsistencies are found in the current experiment design, a redesign is necessary to correct them. Examples of flaws and inconsistencies include inaccurate statement of the problem, choosing the wrong variables and not being able to obtain the required apparatus. The recommended timeframe for redesign is as follows; • 45% - Planning and scheduling • 5-10% - Testing • 45-50% - Reduction, analysis and writing
8. Randomization A randomized, controlled trial is considered the most reliable and impartial method of determining necessary data. Randomization is a process that assigns research participants by chance, rather than by choice, to either the investigation group or the control group. Normally, groups of subjects are organized by age, sex, or education, depending on the experiment, to gather concrete data. This process ensures that the trials are not set to receive the preferred results.
9. Institutional review board In the United States, the Institutional Review Board (IRB) is the standing regulating authority on all experiments conducted on humans to ensure that they protect the rights and welfare of the research subjects. The Food and Drug Administration (FDA) and Department of Health and Human Services regulations have empowered the IRB to approve, require modifications in planned research prior to approval, or disapprove research. Prior to conducting any experiment involving human subjects, approval has to be sought from the IRB. 10. Mathematical model In order to ensure that the experiment is valid, it is useful to develop a mathematical model to the entire system. By doing this, anomalies and infeasible ideas can be weeded out immediately. By basing the experiment upon valid mathematical principles, it ensures that all aspects of the experiment are practical and feasible.
11. Data collection The data collection portion of experiment design must make sure that the experiment is supported by factual data. This involves collecting raw data while adhering to the experimental conditions. The data from this portion is expected to be large and chunky.
12. Data reduction This portion involves cleaning up the raw data into manageable chunks which can then be utilized. Not all the data that was collected may be pertinent and thus should be excluded from the analysis. 13. Data verification The most important part of the entire process is the data verification. This is often done by plotting the reduced data, allowing the experimenter to visually locate significant outlying points which may indicate erroneous data collection. If the data is skewed in anyway, experimenters look back at the methods used and go back to redesign phase or faithfully cite their findings.
[edit] Statistical control
It is best for a process to be in reasonable statistical control prior to conducting designed experiments. When this is not possible, proper blocking, replication, and randomization allow for the careful conduct of designed experiments.[3]
[edit] See also
- Control variable
- Dependent variable
- Experimental techniques
- Glossary of experimental design
- Independent variable
- Randomized controlled trial
- Response surface methodology
- Sample size
- Statistics
- Statistical theory
- Survey sampling
- Taguchi methods
- Factorial experiment
- Fisher's inequality
- Optimal Designs
- Applications:
- Process Analytical Technology (PAT)
- Test and learn
- Retail testing (commercial)
- Clinical trials
[edit] Citations
- ^ Herman Chernoff, Sequential Analysis and Optimal Design, SIAM Monograph, 1972.
- ^ Dr. Paul Green, Industrial and Operations Engineering Adjunct Associate Professor, University of Michigan UMTRI, 2009.
- ^ Bisgaard, S: "Must a Process be in Statistical Control before Conducting Designed Experiments?", Quality Engineering", ASQ, pp 143 - 176, 2008, Vol 20, Nr2
[edit] References
- Box,G. E, Hunter,W.G., Hunter, J.S., Hunter,W.G., "Statistics for Experimenters: Design, Innovation, and Discovery", 2nd Edition, Wiley, 2005, ISBN 0471718130
- Pearl, J. Causality: Models, Reasoning and Inference, Cambridge University Press, 2000.
[edit] External links
- The Unscrambler (free-to-try commercial MVA + DoE software for Windows)
- A chapter from a "NIST/SEMATECH Handbook on Engineering Statistics" at NIST
- Box-Behnken designs from a "NIST/SEMATECH Handbook on Engineering Statistics" ] at NIST
- Articles on Design of Experiments
- Case Studies and Articles on Design of Experiments (DOE)
- Czitrom (1999) "One-Factor-at-a-Time Versus Designed Experiments", American Statistician, 53, 2.
- Design Resources Server a mobile library on Design of Experiments. The server is dynamic in nature and new additions would be posted on this site from time to time.
- Gosset: A General-Purpose Program for Designing Experiments
- Matlab SUrrogate MOdeling Toolbox - SUMO Toolbox - Matlab code for Design of Experiments + Sequential Design + Surrogate Modeling
- SAS Examples for Experimental Design
- WebDOE: a web site that offers free, online design of experiments.
- Design DB: The only database of combinatorial, statistical, experimental block designs
- The I-Optimal Design Assistant: a free on-line library of I-Optimal designs
|
||||||||||||||||||||||||||
|
|||||||||||||||||||||||||||||||||||||||||||||||||||||||||||||

